#23 Insight Creation in Data-Centric Organizations
Subscribe to get the latest
on Tue Sep 29 2020 17:00:00 GMT-0700 (Pacific Daylight Time)
with Darren W Pulsipher, Sarah Kalicin,
In part 5 of a series, Kick-starting your Organizational Transformation to Become Data Centric, Sarah Kalicin, Lead Data Scientist, Intel, and Darren Pulsipher, Chief Solutions Architect, Public Sector, Intel, discuss how to create insight using AI and machine learning in a data-centric organization.
Keywords
#aiml #dataarchitecture #datacentric #data #insight #technology
Listen Here
Using the example of manufacturing widgets, Darren and Sarah previously talked about the data pipeline in an effort to answer a fundamental business question: How many widgets to produce. The complexity becomes apparent when it comes to taking the raw data for customer demand, current supply, and yield loss and converting that into insight.
The first step in this process, before you can decide on which tools to use, is to prepare the data into usable form. Eighty or ninety percent of a data scientist’s work is in preparing and transforming the data so it can be put into an algorithm, for example, or used for pattern recognition.
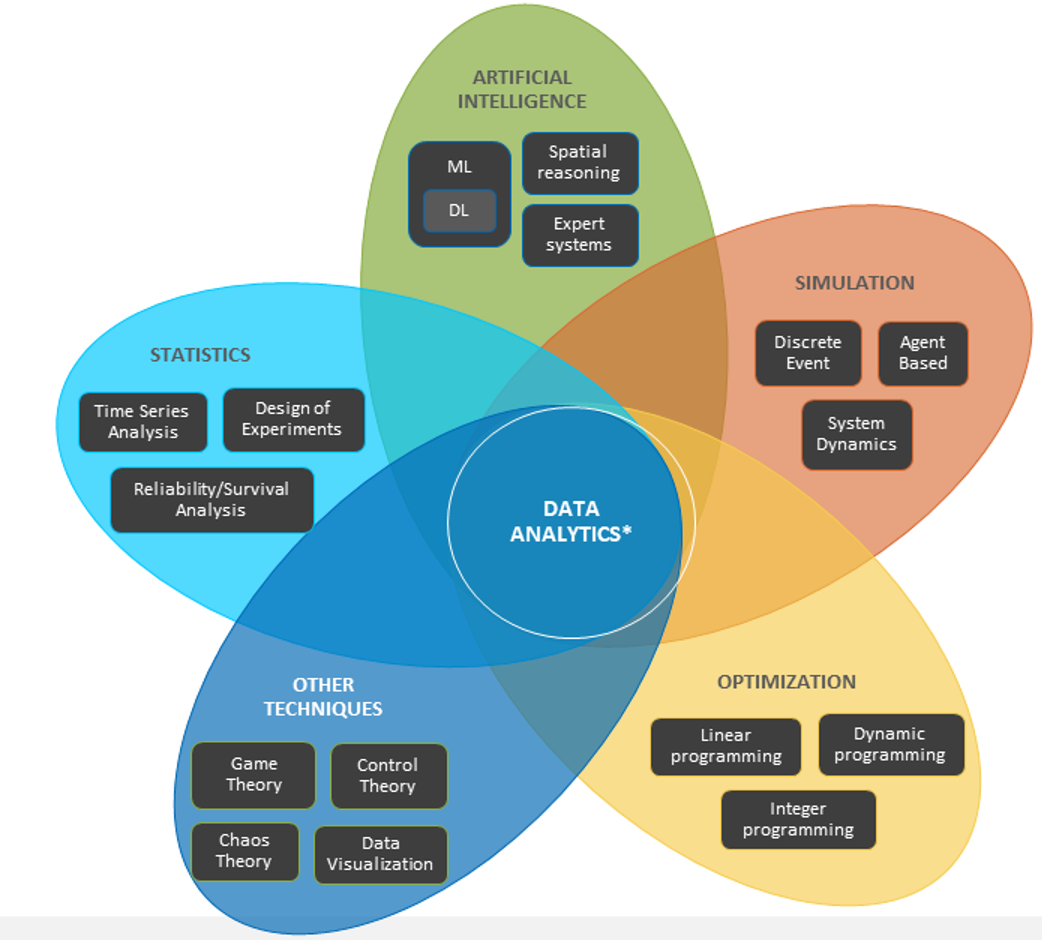
The right tools are complex. AI and machine learning do not use a single algorithm, but a plethora of tools that data scientists use and experiment with in combinations to get the best insight results. In other words, a single algorithm will not tell you how many widgets you should manufacture. There are a lot of overlapping parts, and the tools themselves are complex. In addition, data scientists have different areas of expertise; data science is a team sport. Just as you wouldn’t task a network engineer to design storage architecture, you wouldn’t employ a deep learning engineer who specializes in image recognition to solve your yield analysis problem. You have to hire the right data scientists to design and deploy the right tools to gain insight into your business questions.
Let’s go back to the question of how many widgets you should manufacture. Every situation and model will, of course, be different given the types of questions, data, and dynamics that you have, but we will use this as a starting point. Once this business question is established, the organization will go through an analytic maturity development.
First, you will focus on what has happened in the past to see patterns in demand for your widgets. For example, you might look at some time series data to see when demand for widgets goes up and down. How stable is the information over time and how can you use it to forecast the future? Perhaps you could do some machine learning around this to look at different time segments and understand them. You might also want to do some text analysis such as whether people are talking about your widget on social media. The number of likes or shares could be a data source.
You could do something similar with supply. How stable is the current supply, and how well do you understand the system dynamics? Look at where you need a human to figure out the system dynamics and incorporate that knowledge into the way you do your analytics. There could be some type of machine learning patterns that give you some ideas of insight, so you might do some unsupervised learning. Unsupervised learning is finding whether there are different categories or segments that you’re not aware of that behave differently from each other. Ask how you can track better, or get a better resolution of what is happening in these groups.
In short, depending on where the data is coming from and what you’re looking at in that data, you’re going to be using different tools.
Yield loss is an example of the complexity of the problems to be solved. The more variation in the manufacturing line, the more waste can occur. Machine learning in this case will be looking at segments and clusters of different types of yields. How do you quantify and predict that?
One thing data scientists do here is design of experiments to try and estimate causation. By turning knobs and pulling levers in a systematic way, you can see what happens to yield, while adding process controls to avoid drift.
Another opportunity to run analysis is reliability. For example, with predictive maintenance, your manufacturing tools can be maintained in a timely manner to prevent yield loss. You can also use text analysis in certain situations, such as when you have written records of observations and solutions from technicians over time to use as a collective knowledge base.
Deep learning around image recognition is another strategy to help prevent loss through detection of errors and flaws, and perhaps even categorization of defects.
The goal of all of this is, of course, to gain valuable business insight for your organization. The key is commitment to a data-centric organization, staying flexible, and having the right tools and the right people to turn your data into actionable insight.